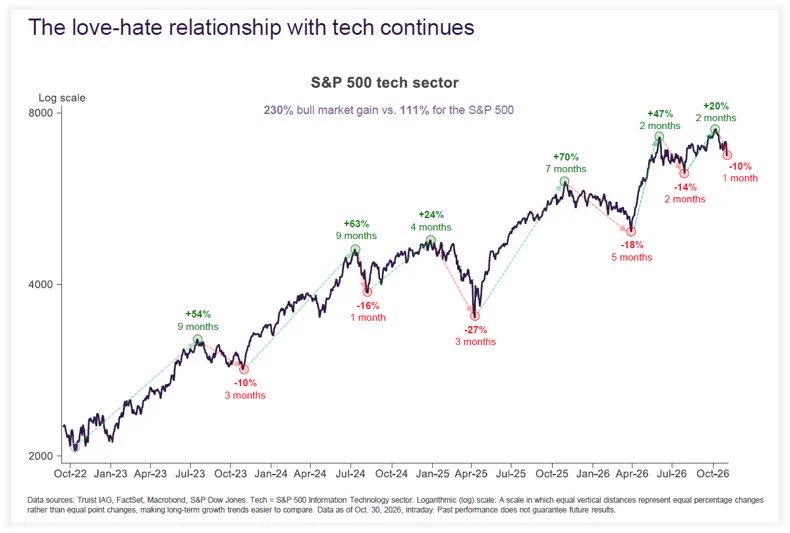
Source: Truist IAG, FactSet, Macrobond, S&P Dow Jones (shared by Brian Sozzi) | Data as of October 30, 2026, intraday | S&P 500 Information Technology sector, log scale
Why we are adding to equities over the next twelve months
The chart below is the S&P 500 technology sector since the October 2022 low, with every pullback marked in red. There are six of them: 10% over three months, 16% in one month, 27% over three months, 18% over five months, 14% over two months, and the one we are in now, 10% over one month. Each one felt like the end while it was happening. Each one was followed by a rise of 20% to 70%.
In fairness, this chart starts at the 2022 low, which is the best starting point there is. The Nasdaq lost about 78% from its 2000 peak to its 2002 low, and the buyers of the first 10% drop were early by two and a half years. So we do not claim dips always recover. We claim that this setup has shown up six times in four years, and the people who sold each time missed the next leg.
A bubble bursts when the thing everyone is paying for stops selling. So what did the customers do last quarter? Google Cloud grew 103% to $30.7 billion. Azure grew 48%. AWS grew 39%. Taiwan Semiconductor, which makes the chips behind all of it, reported record profit of NT$763 billion, up 68.7%, and its CEO said AI demand is still above what the company can supply. Even Intel, which plunged on Friday after soft PC guidance, said its data center and AI revenue grew 78%.
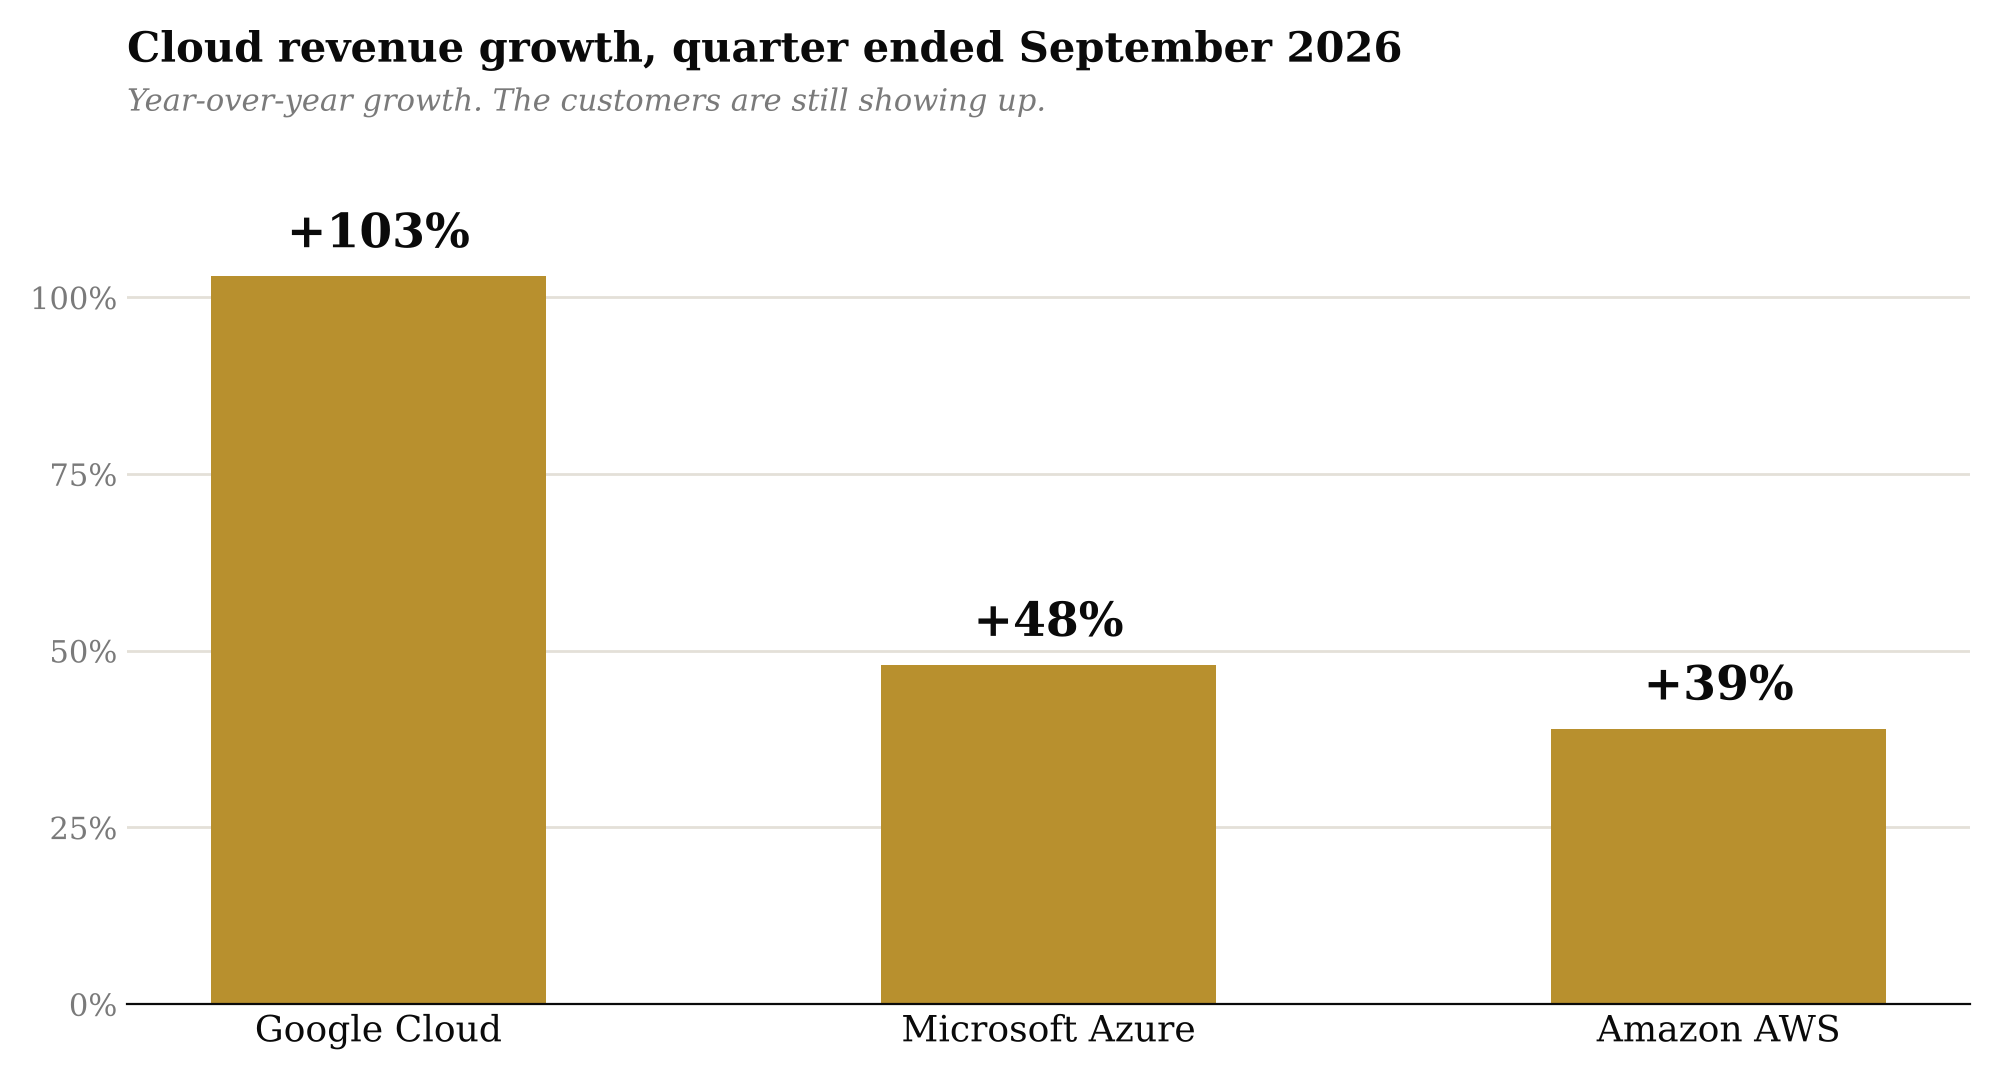
In 2000 the damage started when the customers of the equipment makers ran out of money and orders dried up. Today the orders are growing faster than the factories can fill them. The stock prices fell. The revenue lines did not.
This chart did not get the attention it deserved. In the third quarter of 2024, Google Search brought in $49.4 billion of advertising revenue and Meta's Family of Apps brought in $39.9 billion, a gap of $9.5 billion. Today it is $63.4 billion against $63.1 billion. Meta grew 26% year over year in the quarter. Google Search grew 12% and was flat from the quarter before. If those rates hold, Meta passes Google Search in the next quarter or two.
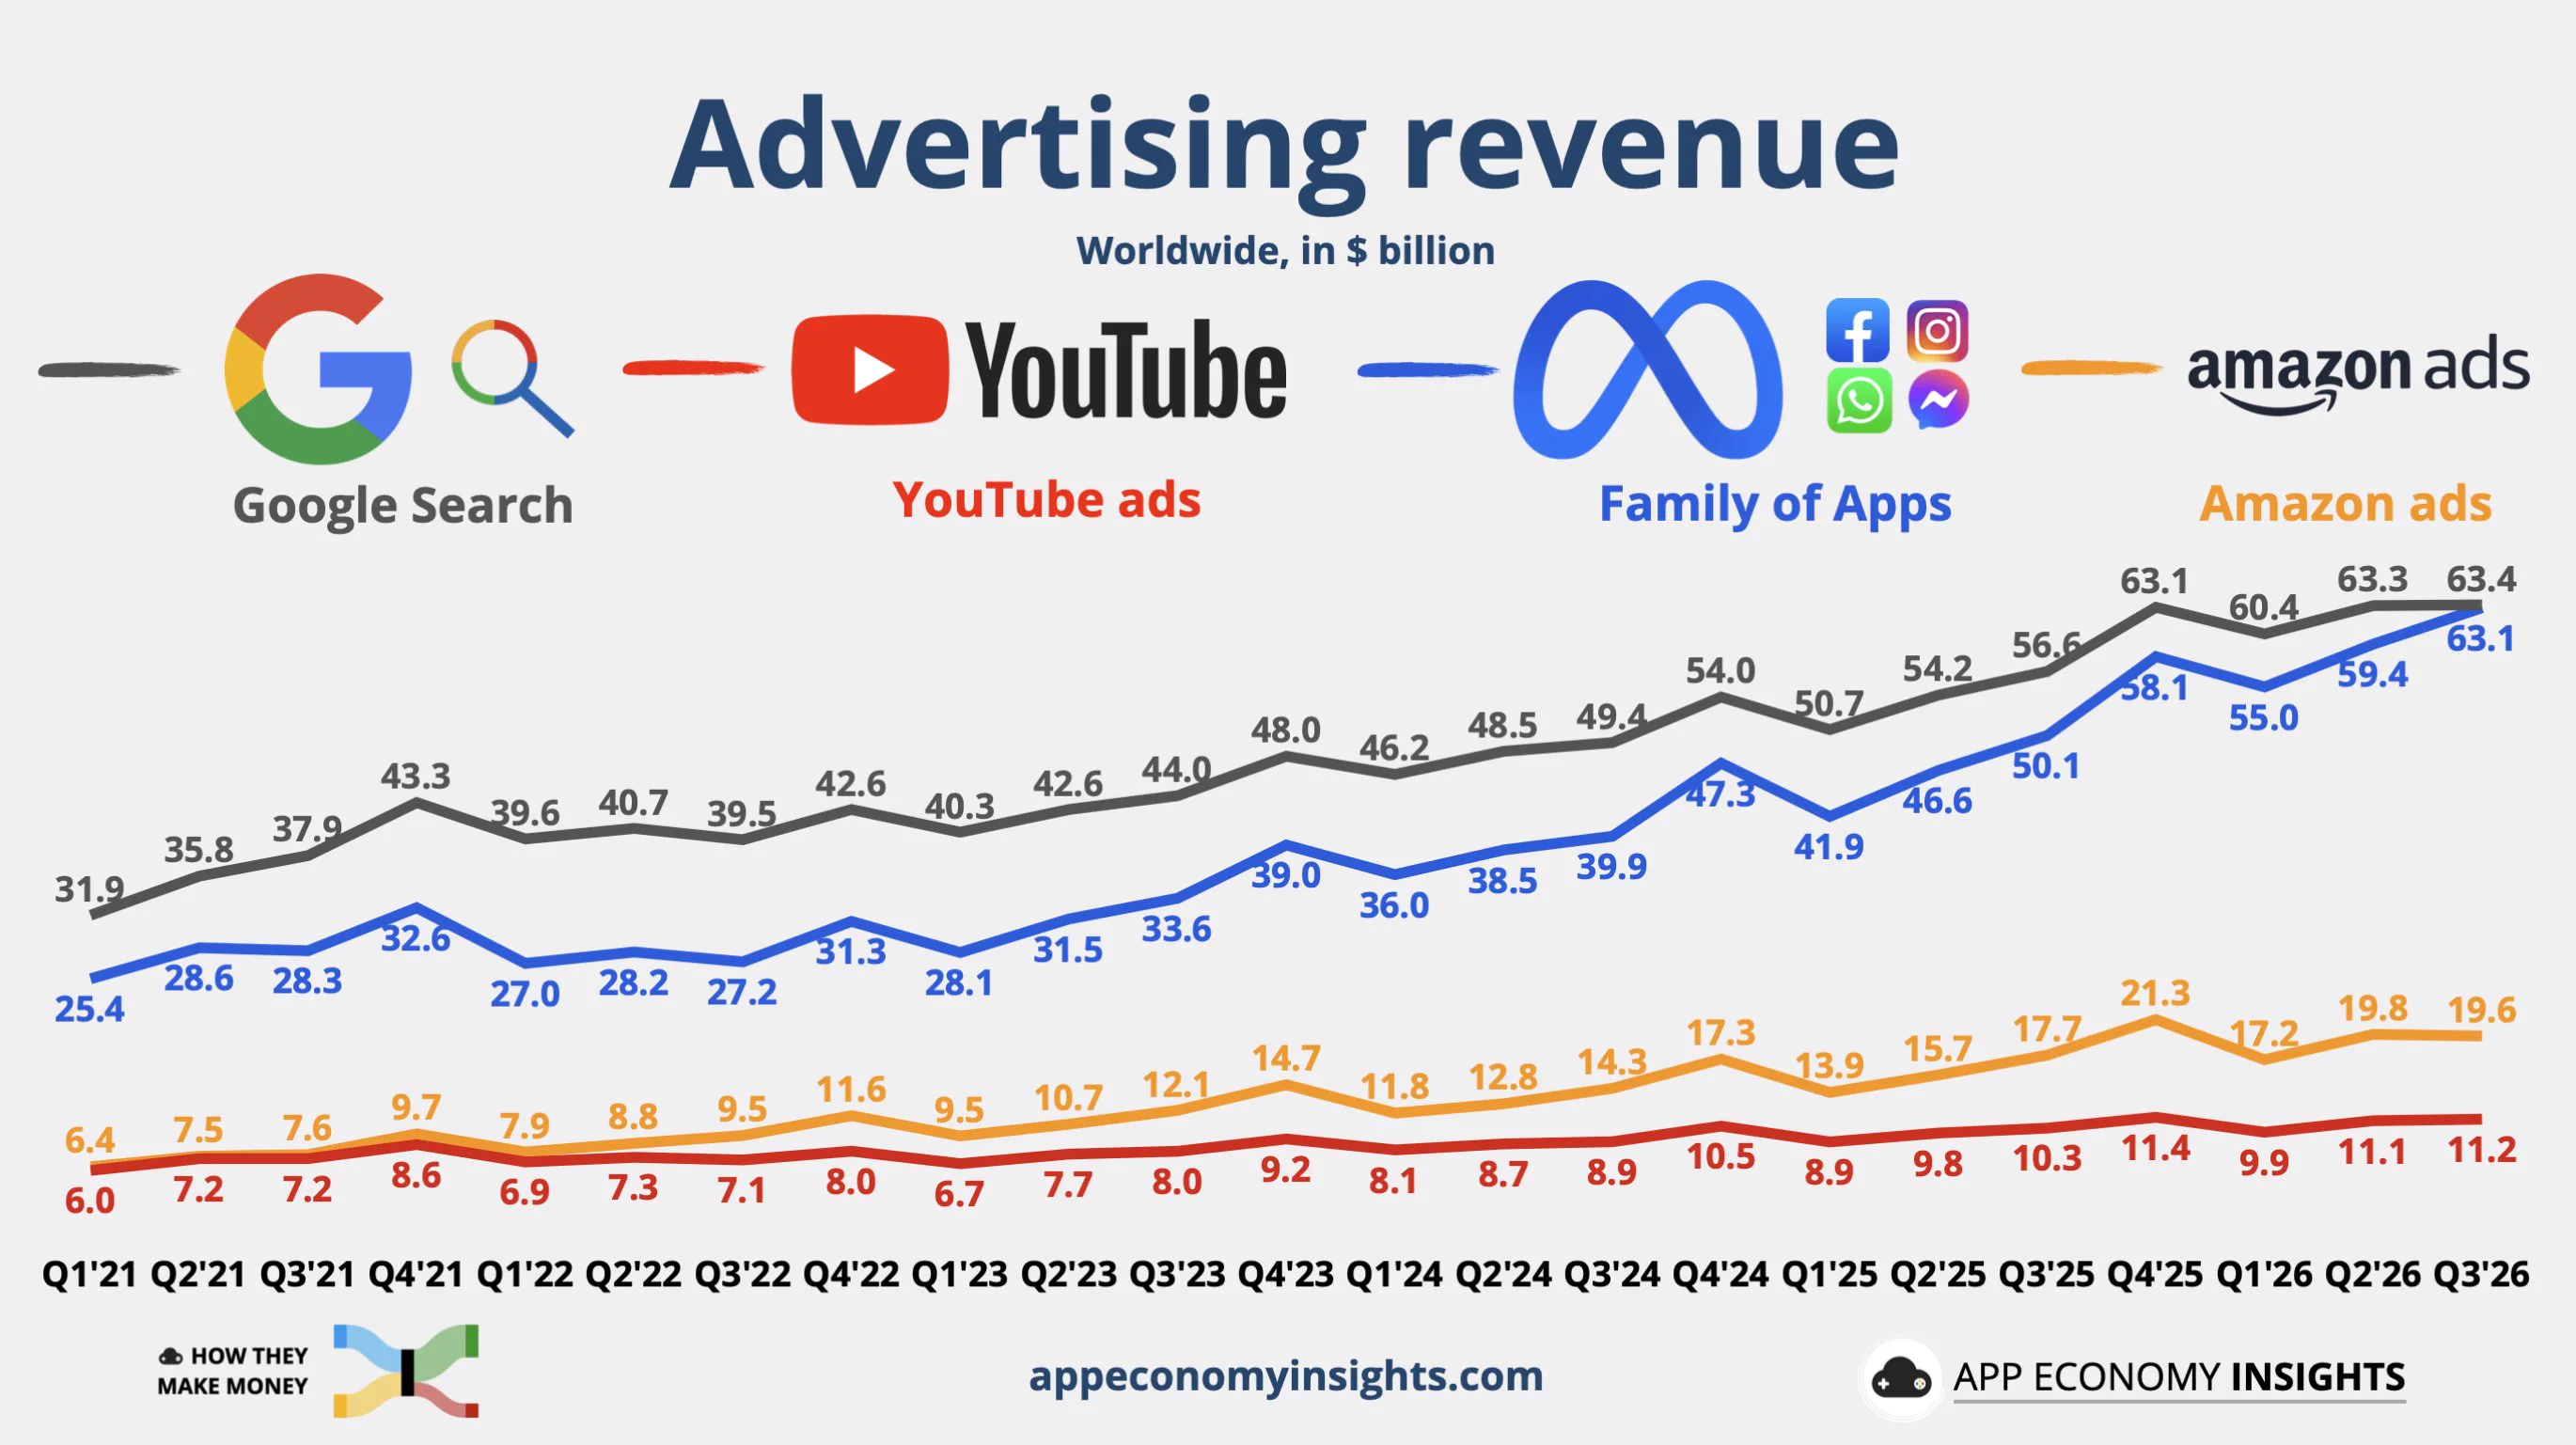
This is the engine that pays for the buildout. Alphabet said AI-powered search queries earn less per query than classic ones, which is a point against Google and a point for the company that was never in the search business. Meta's shares fell because free cash flow turned negative at $2.12 billion, its first negative quarter in more than a decade, and because it announced a raise of up to $95 billion in new equity. That is a real cost to shareholders and we are not going to wave it away. We hold Meta and we disclose it below. The ad engine in that chart is why we are comfortable.
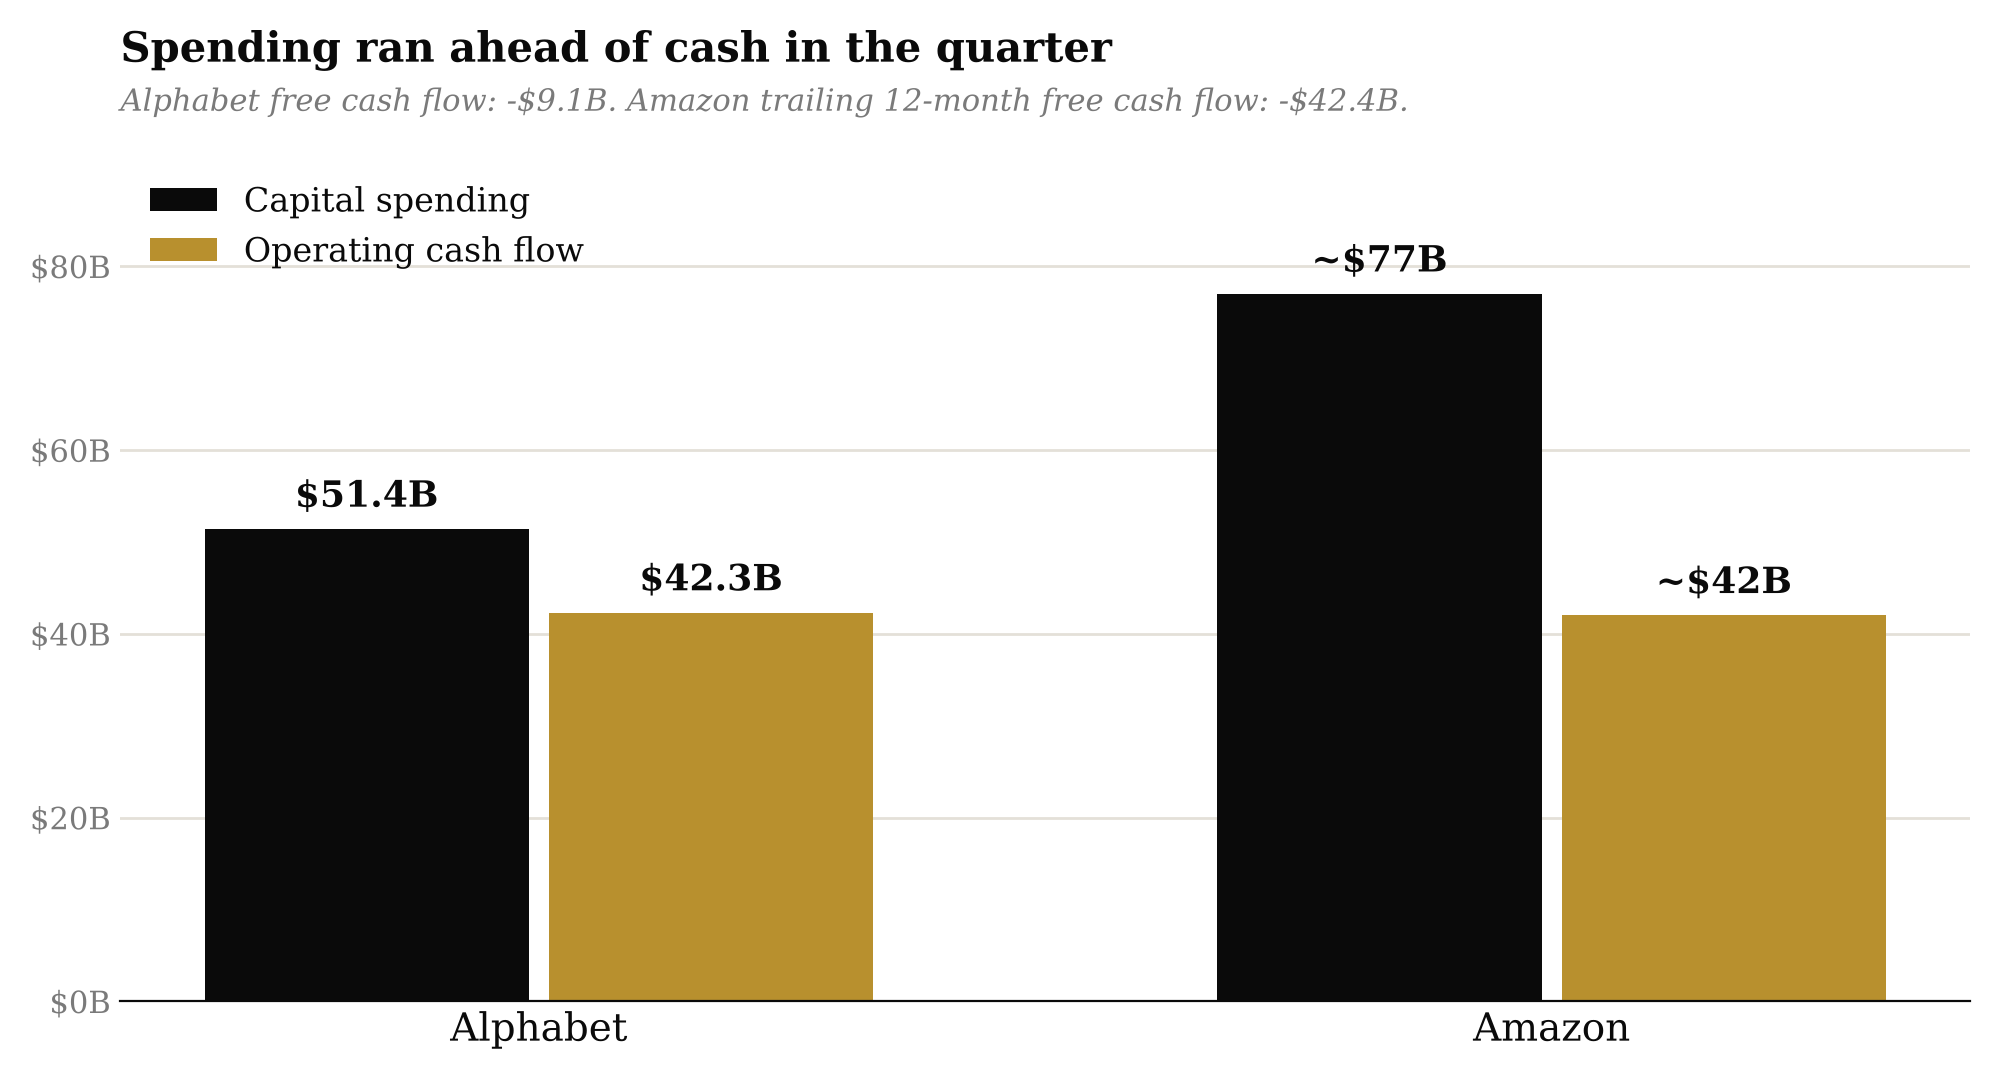
Alphabet spent $51.4 billion on capex in the quarter, up 114%, and its free cash flow was negative $9.1 billion. Amazon spent about $77 billion against roughly $42 billion of operating cash, and its trailing twelve-month free cash flow is negative $42.4 billion. Free cash flow is operating cash flow minus capital spending. When it goes negative, a company has to borrow or sell stock to cover the gap. The market is right to price that.
The bear case is serious. Gartner estimates AI data centers need about $8.5 trillion of revenue through 2030 to cover their costs and a 12% return, against at most $3.6 trillion expected. The 10-year yield is near 5%, the Fed held on October 28 with two dissenters asking for a hike, and companies are now selling stock to fund the build, which has been a late-cycle sign before. We take all of it seriously.
But a funding problem can be fixed by time, cheaper money, or cash engines growing into the spending. A demand problem cannot. The companies buying the capacity are among the most profitable in the world. What breaks this thesis is funding shutting down while revenue growth slows at the same time.
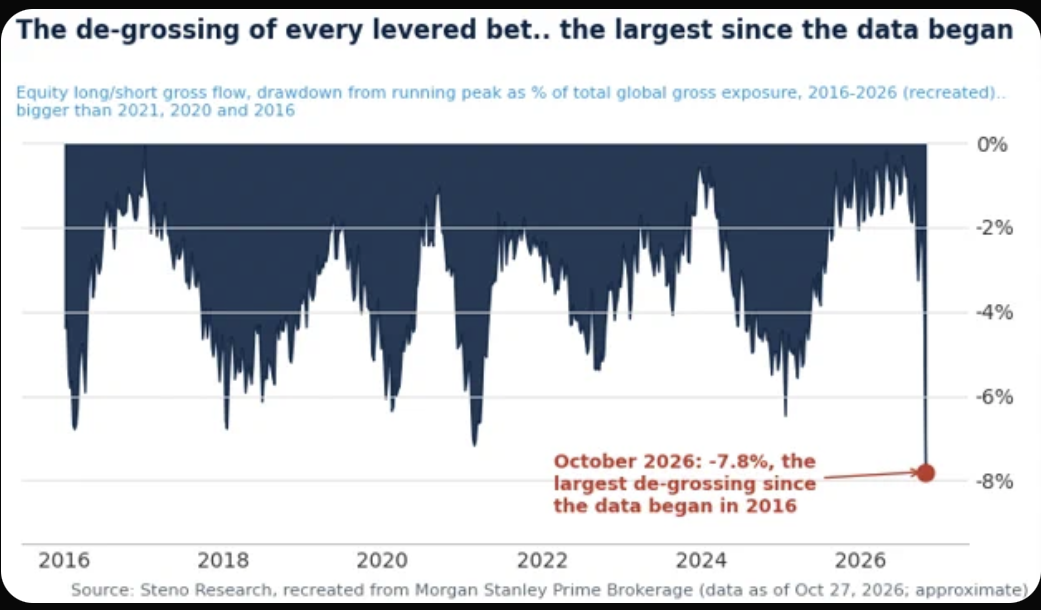
Steno Research, using Morgan Stanley Prime Brokerage data, shows hedge fund equity gross exposure down 7.8% from its running peak, the largest cut since the data began in 2016. The series is recreated and approximate, and it ends October 27, before the worst of the last two days. Forced sellers are selling because of their own balance sheets, not the news. When that pressure ends, there are fewer sellers left.
QQQ also just ended a month with a loss of 4.84% or worse over the final two days. It has happened seven times ever. Here is how the other six went.
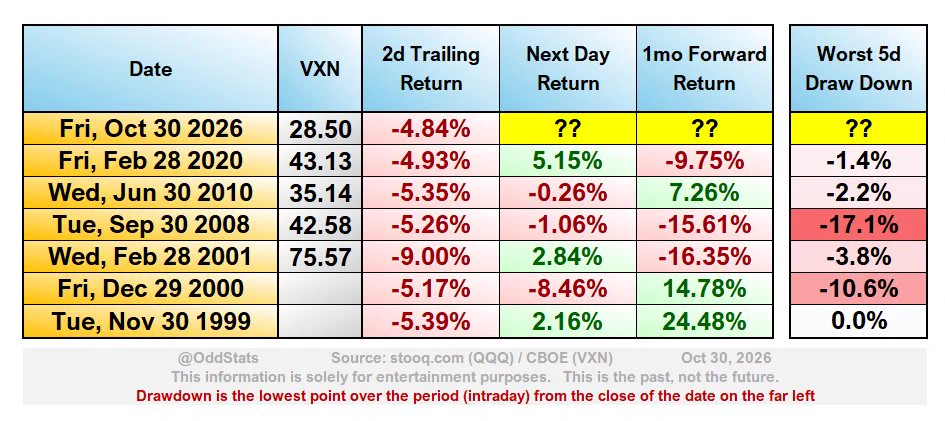
This table is not a green light, and we would rather you hear that from us. A month later, three cases were up (+7.3%, +14.8%, +24.5%) and three were down (-9.8%, -15.6%, -16.4%). The ones that fell were the pandemic, the financial crisis and the 2001 bust. In the two worst cases the next five days still lost 17.1% and 10.6%. Today's fear gauge, the VXN, is 28.50, lower than the 43.13, 42.58 and 75.57 in the three bad cases. That means this is not a crisis reading. It also means the market has not shown the panic that usually marks the lows. That is why we add in stages.
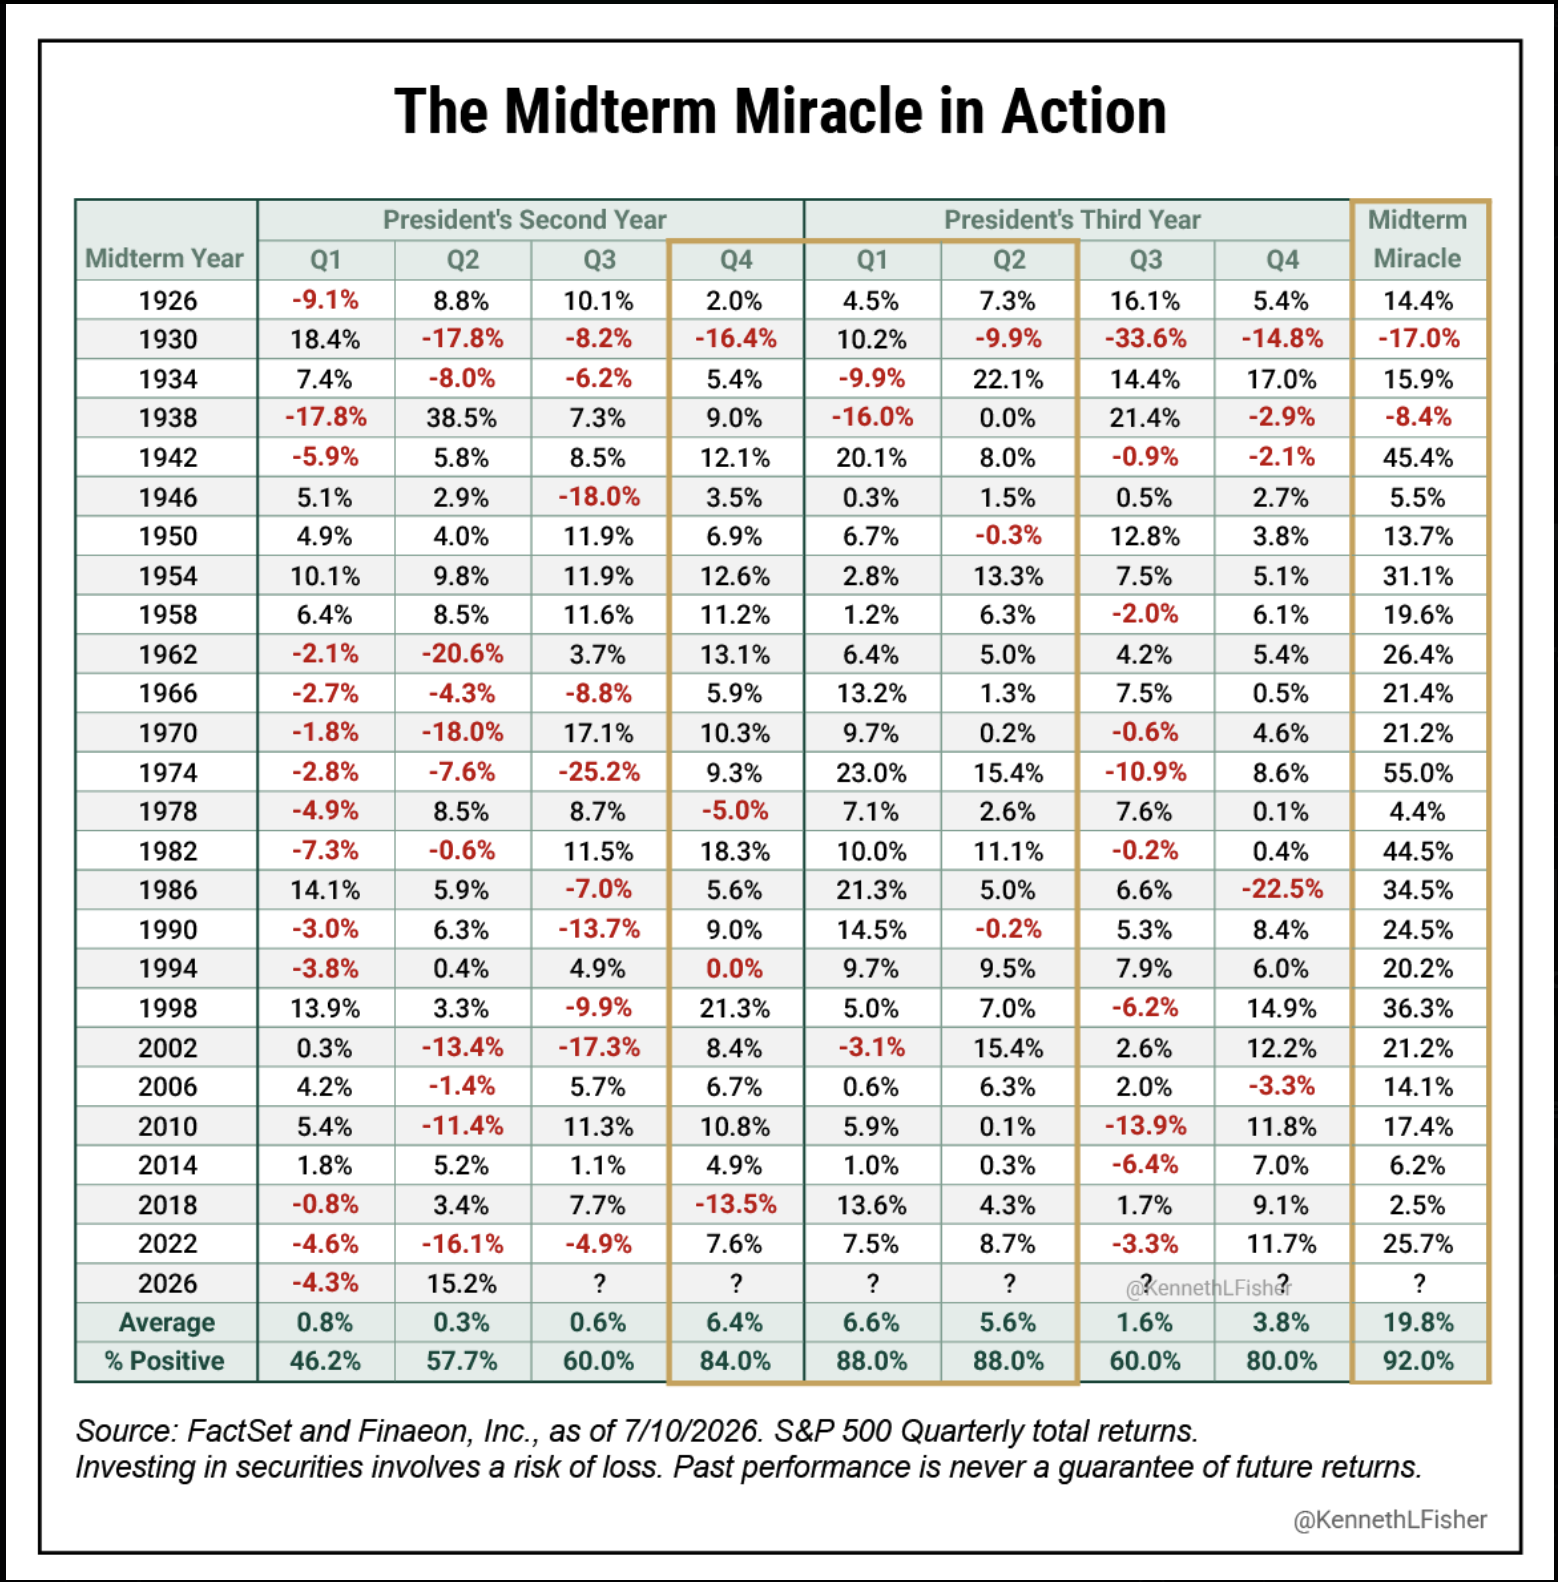
The calendar helps. The midterm election is Tuesday, November 3. Since 1926, the fourth quarter of a midterm year plus the next two quarters has been positive 92% of the time, with an average gain of 19.8%. The Fed meets again on December 9, and the market already prices a hike, so that meeting is less likely to surprise anyone.
Here is how we are doing it. We split new money into three parts. One goes in now. A second goes in after the election and the December Fed meeting. A third is held back in case the market gives us a deeper drop. We would rather add at a worse price on part of the money than miss the move entirely, and we would rather miss a little of the low than put everything in on day one. Our focus is technology and semiconductors, and our view runs twelve months.
We would change our mind if funding shuts and growth slows together, if the 10-year yield moves decisively above its recent highs, or if the Fed turns one hike into a long series of them. We will say so here if that happens.
People sell moments like this because the headlines say the cash flow statement is broken. We think the revenue line matters more. When customers keep ordering faster than the factories can build, a bubble has not popped. It has had a bad month, and those tend to be the months worth buying.
Disclosure: Double Eleven Capital holds a position in Meta Platforms, Inc. (META) as of October 31, 2026. This memo reflects our sector-level view on technology and semiconductors, and we do not name any other security or fund. Double Eleven Capital & Co. and its partners may hold positions in companies within these sectors.